Whenever I need to graph something I reach for a spreadsheet. e.g.
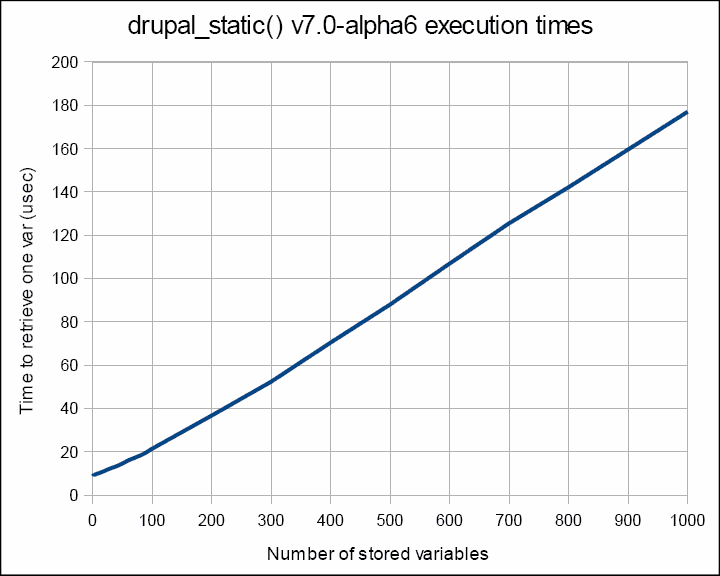
OpenOffice Calc. The Calc program offers quite a few chart types: (e.g. column, bar, pie, area, line, XY scatter, Net, stock, column and line.) It takes a little bit of effort to learn how to get the graph looking like you want, but the results are pretty good. However, getting a decent .PNG file requires some trickery: long-story-short - first export the spreadsheet document as a PDF file then use a screen capture program to capture the image in the resolution you need by using the zoom function in the PDF display program. Below is an x-y line graph I threw together recently for some work I was doing over on the Drupal project...

graphs software
However, I understand that there is a new (better) fork of the OpenOffice project, since Oracle aquired Sun...
But as mouser suggested, there are probably better alternatives.
