I was inspired to experiment a little today with the stats and graphs to verify some expectations using simulated data.
So I added some code to let me use the standard python random number generator (which turns out to be quite fair looking) to simulate dice rolls, and then injected some biases to see if they could be detected.
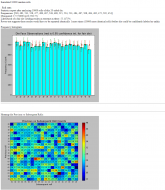
So here is a simulated 20 sided die that is ever so slightly unfair. It has a 0.2% chance (0.002 probability) that any given roll will be same as previous roll, and a 0.2% chance above normal equal probability that it will land on face side 01.
So our first screenshot is with 10,000 rolls. The stats analysis of the software says it could very well be a fair die -- insufficient evidence to suggest otherwise:
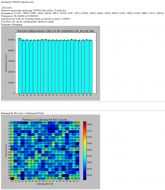
Now we try 100,000 rolls. And now we start to see a pattern, and we have enough rolls to be pretty certain of our evidence that the die is unfair. The lower heatmap shows correlations between pairs of rolls -- after 100,000 rolls of a d20 it's hard to visually see patterns there (yet).

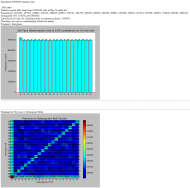
Let's try a 1,000,000 rolls and see how it looks. Yep now we are virtually certain that the die is quite biased. And now in the lower heatmap you can see the hotter colors on the bottom row and leftmost column and on the diagonal, showing the bias between pairs of rolls:
And just for the hell of it here are 10,000,000 rolls:

 Recent Posts

