I thought it would be worth while for me to post a screenshot of a simulation and visually demonstrate the difference between the simulator picking a winner and advising a bet.
Let's look at one person's ratings data used to simulate the world cup on June 3rd, 2010, with current betting odds. After running for 30 minutes or so here are the results:
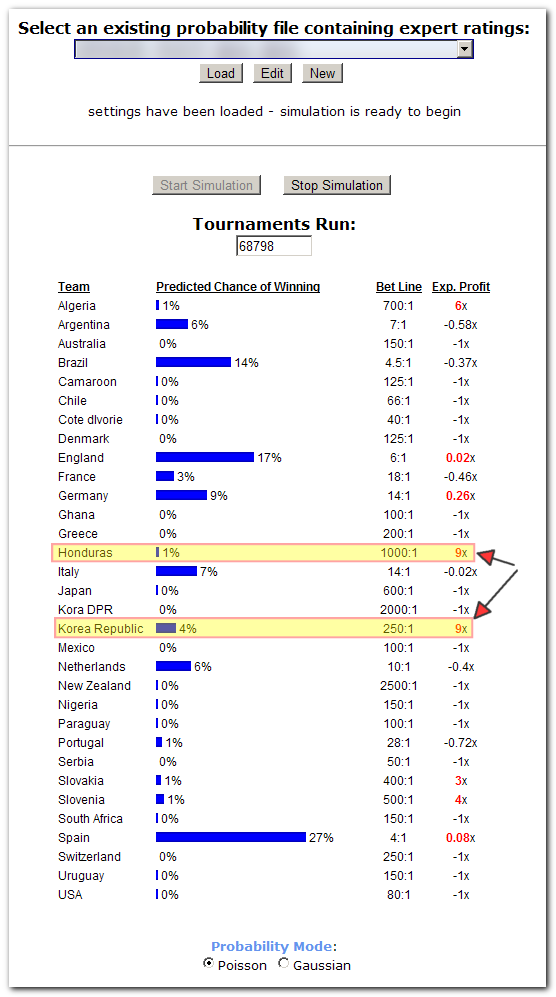
We see that using this person's pair-wise team match up ratings, the simulator predicts that
Spain has the best chance of winning the tournament (27% chance) followed by England (17%), Brazil (14%), Germany (9%), Italy (7%), Netherlands (6%), Argentina (6%); this is shown by the blue bars.
However, looking at the far right column, we see the expected profit from betting on the different teams; red numbers mean a positive profit is expected (negative numbers mean predicted loss of money).
Note that none of the teams with a high likelyhood of winning are good bets(!) Why? Because too many people are already betting on them and the payoffs for betting on them are so low.
The simulator advises betting on Honduras and South Korea, because even though these teams have a relatively small predicted chance of winning (1% and 4% respectively), their high payoffs make the bet a smart one.
REMEMBER: THIS IS THE RESULT OF ONE PERSON'S RATING FILE ESTIMATING HOW THE TEAMS MATCH UP PAIRWISE -- IF YOU USED A DIFFERENT PERSON'S RATINGS YOU WOULD GET DIFFERENT RESULTS!!!
 Recent Posts
