topbanner_forum
  *

avatar image

Welcome, Guest. Please login or register.
Did you miss your activation email?

Login with username, password and session length
  • Sunday December 8, 2024, 5:59 am
  • Proudly celebrating 15+ years online.
  • Donate now to become a lifetime supporting member of the site and get a non-expiring license key for all of our programs.
  • donate

Author Topic: SWOT software  (Read 4522 times)

Contro

  • Supporting Member
  • Joined in 2007
  • **
  • Posts: 3,940
    • View Profile
    • Donate to Member
SWOT software
« on: July 16, 2017, 02:57 PM »
I am searching for SWOT software. Swot Analysis, not only diagrams. Better free.

Do you know software for this in excel, Smartdraw, etc ?

Best Regards
 :-*

Contro

  • Supporting Member
  • Joined in 2007
  • **
  • Posts: 3,940
    • View Profile
    • Donate to Member
Re: SWOT software
« Reply #1 on: July 16, 2017, 03:24 PM »
« Last Edit: July 16, 2017, 05:07 PM by Contro »

Curt

  • Supporting Member
  • Joined in 2006
  • **
  • Posts: 7,566
    • View Profile
    • Donate to Member
Re: SWOT software
« Reply #2 on: July 16, 2017, 04:59 PM »
https://www.smartshe...t-analysis-templates

^ forgive me for asking, Contro, but did you just create and perform an Internet search all on your own?!
 8)

Contro

  • Supporting Member
  • Joined in 2007
  • **
  • Posts: 3,940
    • View Profile
    • Donate to Member
Re: SWOT software
« Reply #3 on: July 16, 2017, 05:09 PM »
https://www.smartshe...t-analysis-templates

^ forgive me for asking, Contro, but did you just create and perform an Internet search all on your own?!
 8)

Not exactly. I search and found some information. Then test it. The templates goes like a charm.

There are a lot of modifications of swot analysis and possibly is not easy automate all this. Just thinking !

 :P
« Last Edit: July 16, 2017, 05:20 PM by Contro »

Contro

  • Supporting Member
  • Joined in 2007
  • **
  • Posts: 3,940
    • View Profile
    • Donate to Member
Re: SWOT software
« Reply #4 on: July 16, 2017, 05:25 PM »
A community tools box with swot option

http://ctb.ku.edu/en/toolkits


Swot analysis generator

http://www.wikiwealt...t-analysis-generator


ital2

  • Member
  • Joined in 2017
  • **
  • default avatar
  • Posts: 115
    • View Profile
    • Donate to Member
Re: SWOT software
« Reply #5 on: July 23, 2017, 02:19 PM »
SWOT Compare

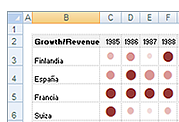
There are some (free or paid) macro collections for Excel; by chance, some days ago, I saw a very beautiful bullet chart somewhere ( https://www.poweruse...ft-Excel-free-or-not ), I took a tiny, partial screenshot from the screenshot (right of citation):
Heatmap 1.png

It's called "Dashboard Tools for Excel" (45$) there, but it's obvious that is has been renamed "Tools for Excel Tables" (price maintained), and under http://jabsoft.com/t...ert_bullet_chart.htm you'll find another specimen of which I also took a tiny part for demonstration:

Heatmap 2.png

SWOT is more specific, but I like bullet charts very much, they're very useful for lots of things; you can include SWOT by color into them; weighting has to be discussed though since bullet size regularly would mean strength of the factor in the given element, and not the weight you give to the factor represented in the element; it wouldn't be a good idea to combine them I think, but you could use background color / greyness for the "weighting", or, better, modulate the given color (red would be risks, green would be chances, etc., but a lighter green on a bigger bullet would then be a quite big chance but which isn't valued big, and so on.

Perhaps the same would be possible with PowerPoint or even in Excel's own graphics department? And what about risky chances? And there's the old saying that "it's all playing around since you do your weighting according to the decisions you will already have done before", but that's not entirely true, and you certainly 1) will find out this way what really matters to you(r corporation or similar), 2) with which disadvantages you are / must be willing to live then.

Anyway, my musings above go into the direction of a compared SWOT analysis, or, shorter, a "SWOT Compare"; the traditional form of SWOT (see @Contro's links) isn't that much suited to a compared SWOT, when in fact, SWOT is about comparing alternatives, most of the time (even if then several alternatives will be realized in case).

Thus, trying to put several dimensions into such a table is worthwile, but then, it could become difficult or even impossible (i.e. too much scripting involved) to generate such a table from an Excel/spreadsheet table: You will probably end up doing it "manually", in an independent business graphics tool, or in some combination: Creating 2 dimensions in Excel (hard data if there is any, or then just simili-data, i.e. 1 dimension from deliberately-attributed numbers: size; also factors = Excel rows: color*), to be imported into the chart, and then manual work (which may not be possible with Excel add-ins) in order to add a / get the third dimension (or even a fourth one, but I fear comprehension will suffer then, but yes, if you have got one dimension with only a few possible values, you could try to combine different shapes).

*: It goes without saying that lots of Excel rows will then only apply to some alternatives or even just one alternative, but at least, the identical / similar factors can be grouped together (by different dimensions, hopefully), and that helps a lot with deciding and/or planning, just like, but much better than, positioning two sheets of vellum one on top of the other, pair by pair, and trying to get the matches visually.

Thus, a "SWOT Compare", or a Compared SWOT is certainly better in most use cases, hence the interest of more elaborate graphical representations.


EDIT: I see the second table in @Contro's first link is a comparison, but it's not multi-dimensional as I advocate it here. Also have a look at the very last table in that link: On first sight, you could think all those buttons on the left are filter and sort buttons, but that's unfortunately not the case: Such buttoms would be very welcome in such a tool, and they would be technically feasible: Their affectations would have to be plastic, according to the table in question. So it's evident that at the end of the day, SQL's the "answer" here again: Just have generic buttons, for some number of different SQL selects*, to be written by the user, specific to the table in question, and to be assigned to those buttons, just like macros are assigned to kb keys; since we're speaking of screen buttons here, there would be captions, and more informative mouse-overs; the selects (i.e. the filters/sorts), with their code and all, would be stored in records in some SQL table on their turn, just as would be the "tables", i.e. the data and all possible dimensions of their metadata with their respective values.

*: As we know, SQL "selects" do much more than just "select".
« Last Edit: July 23, 2017, 02:59 PM by ital2 »

Contro

  • Supporting Member
  • Joined in 2007
  • **
  • Posts: 3,940
    • View Profile
    • Donate to Member
Re: SWOT software
« Reply #6 on: July 23, 2017, 05:54 PM »
SWOT Compare

There are some (free or paid) macro collections for Excel; by chance, some days ago, I saw a very beautiful bullet chart somewhere ( https://www.poweruse...ft-Excel-free-or-not ), I took a tiny, partial screenshot from the screenshot (right of citation):

[ Invalid Attachment ]

It's called "Dashboard Tools for Excel" (45$) there, but it's obvious that is has been renamed "Tools for Excel Tables" (price maintained), and under http://jabsoft.com/t...ert_bullet_chart.htm you'll find another specimen of which I also took a tiny part for demonstration:

[ Invalid Attachment ]

SWOT is more specific, but I like bullet charts very much, they're very useful for lots of things; you can include SWOT by color into them; weighting has to be discussed though since bullet size regularly would mean strength of the factor in the given element, and not the weight you give to the factor represented in the element; it wouldn't be a good idea to combine them I think, but you could use background color / greyness for the "weighting", or, better, modulate the given color (red would be risks, green would be chances, etc., but a lighter green on a bigger bullet would then be a quite big chance but which isn't valued big, and so on.

Perhaps the same would be possible with PowerPoint or even in Excel's own graphics department? And what about risky chances? And there's the old saying that "it's all playing around since you do your weighting according to the decisions you will already have done before", but that's not entirely true, and you certainly 1) will find out this way what really matters to you(r corporation or similar), 2) with which disadvantages you are / must be willing to live then.

Anyway, my musings above go into the direction of a compared SWOT analysis, or, shorter, a "SWOT Compare"; the traditional form of SWOT (see @Contro's links) isn't that much suited to a compared SWOT, when in fact, SWOT is about comparing alternatives, most of the time (even if then several alternatives will be realized in case).

Thus, trying to put several dimensions into such a table is worthwile, but then, it could become difficult or even impossible (i.e. too much scripting involved) to generate such a table from an Excel/spreadsheet table: You will probably end up doing it "manually", in an independent business graphics tool, or in some combination: Creating 2 dimensions in Excel (hard data if there is any, or then just simili-data, i.e. 1 dimension from deliberately-attributed numbers: size; also factors = Excel rows: color*), to be imported into the chart, and then manual work (which may not be possible with Excel add-ins) in order to add a / get the third dimension (or even a fourth one, but I fear comprehension will suffer then, but yes, if you have got one dimension with only a few possible values, you could try to combine different shapes).

*: It goes without saying that lots of Excel rows will then only apply to some alternatives or even just one alternative, but at least, the identical / similar factors can be grouped together (by different dimensions, hopefully), and that helps a lot with deciding and/or planning, just like, but much better than, positioning two sheets of vellum one on top of the other, pair by pair, and trying to get the matches visually.

Thus, a "SWOT Compare", or a Compared SWOT is certainly better in most use cases, hence the interest of more elaborate graphical representations.


EDIT: I see the second table in @Contro's first link is a comparison, but it's not multi-dimensional as I advocate it here. Also have a look at the very last table in that link: On first sight, you could think all those buttons on the left are filter and sort buttons, but that's unfortunately not the case: Such buttoms would be very welcome in such a tool, and they would be technically feasible: Their affectations would have to be plastic, according to the table in question. So it's evident that at the end of the day, SQL's the "answer" here again: Just have generic buttons, for some number of different SQL selects*, to be written by the user, specific to the table in question, and to be assigned to those buttons, just like macros are assigned to kb keys; since we're speaking of screen buttons here, there would be captions, and more informative mouse-overs; the selects (i.e. the filters/sorts), with their code and all, would be stored in records in some SQL table on their turn, just as would be the "tables", i.e. the data and all possible dimensions of their metadata with their respective values.

*: As we know, SQL "selects" do much more than just "select".

Nice indeed !

Running to try !

 :-*