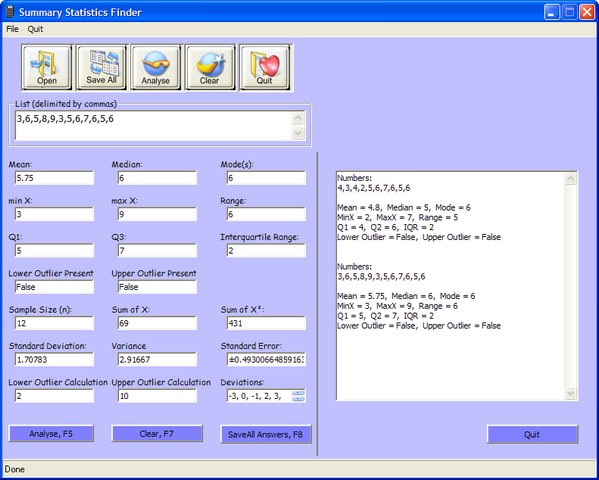
I've been looking for something like this for a while. Ive started playing with a vb program by Anton Venema,as shown below

I'm half way there, but need help on how to:
1. List the outliers
2. Put the original values in ascending order.
3. Accurately plot a boxplot with outliers
I'm thinking of putting the answer values into a rich textbox so that I can include a boxlot sketch.
What the program does so far:
After inputting some numbers (seperated with commas) the program works out statisical values like mean, median, mode, range, etc. It then outputs the results into a text box and adds the next results to the text box after the next number values have been entered. Lastly the results can be dragged and dropped into Word for Windows for additional editing.
Next RTF version coming soon (I hope).
