


A couple of graphs -- I probably dont fully understand how they work, but did find interesting:
The Coronavirus Curve - Numberphile
How To Tell If We're Beating COVID-19
The animated graph the above video is based on is here (updated at link)
(note: logarithmic scale; time implied (neither on x nor y axis -- explained in video)
The Coronavirus Curve - Numberphile
How To Tell If We're Beating COVID-19
The animated graph the above video is based on is here (updated at link)
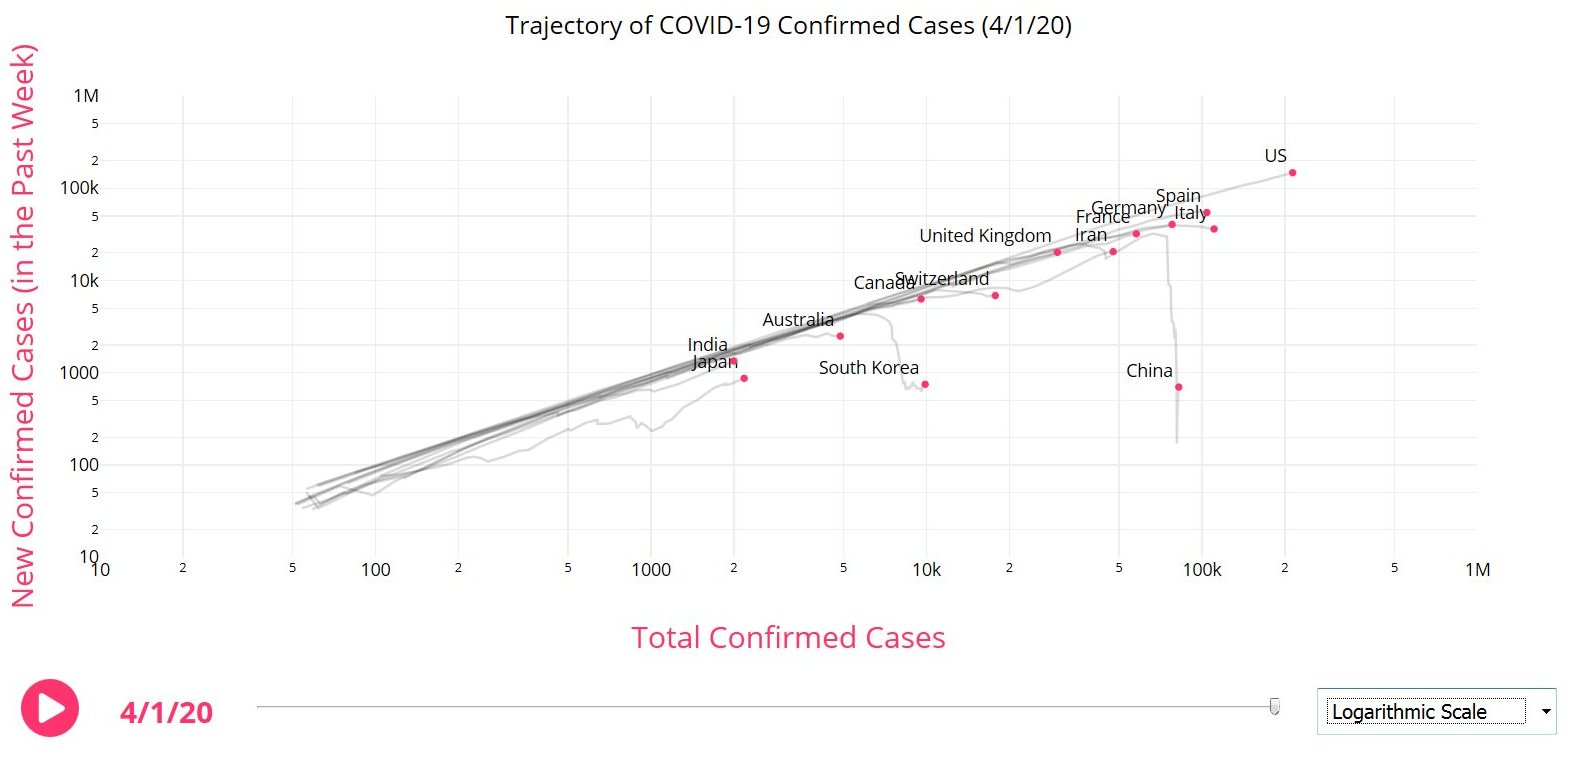
(note: logarithmic scale; time implied (neither on x nor y axis -- explained in video)
