DonationCoder.com forum
 
Read-only archive. This is a static copy of the DonationCoder.com forum. Reading and searching work as before; logging in, posting and private messages do not.
Archive of 2026-10-21 · About this archive · Main site

Author Topic: Extremely cool visualization of global statistics over time.  (Read 22,194 times)

JavaJones

  • Review 2.0 Designer
  • Charter Member
  • Joined in 2005
  • ***
  • Posts: 2,739
    • Participated in NANY Challenge Once
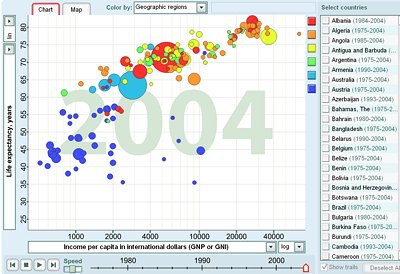
Google and Gapminder have gotten together to create a very cool graphing visualizer of a bunch of interesting world statistics. And the coolest part is you can graph it over time and actually watch as the stats change! Compare average lifespan to number of physicians per capita and see if doctors really make us live longer - then watch the graph change over up to 50 years of data. Cool stuff. :)

http://tools.google.com/gapminder/

gapminder_app.jpg

- Oshyan

mouser

  • First Author
  • Administrator
  • Joined in 2005
  • *****
  • Posts: 40,931
    • Gathering Badge
    • Plugin Coding Medal
    • Participated in NANY Challenge Seventeen Times
    • Cody Award
    • Coding Snacks
    • Volunteers/Staff
Re: Extremely cool visualization of global statistics over time.
« Reply #1 on: June 02, 2006, 03:50 AM »
that is very VERY cool.

hamradio

  • Amateur Radio Guy
  • Charter Honorary Member
  • Joined in 2006
  • ***
  • Posts: 893
    • Plugin Coding Medal
    • Participated in NANY Challenge Fifteen Times
    • Cody Award
    • Coding Snacks
    • Volunteers/Staff
    • Hardware Hacker
Re: Extremely cool visualization of global statistics over time.
« Reply #2 on: June 02, 2006, 03:59 AM »
Nice!

jgpaiva

  • Artificial Idiocy
  • Global Moderator
  • Joined in 2006
  • *****
  • Posts: 4,727
    • Cody Award
    • Participated in NANY Challenge Once
    • Coding Snacks
    • Portugal Inhabitant
    • Linux User
Re: Extremely cool visualization of global statistics over time.
« Reply #3 on: June 02, 2006, 10:25 AM »
Very interesting, great find JavaJones!  :Thmbsup:

Rover

  • Master of Smilies
  • Charter Member
  • Joined in 2005
  • ***
  • Posts: 633
    • Linux User
Re: Extremely cool visualization of global statistics over time.
« Reply #4 on: June 02, 2006, 01:17 PM »
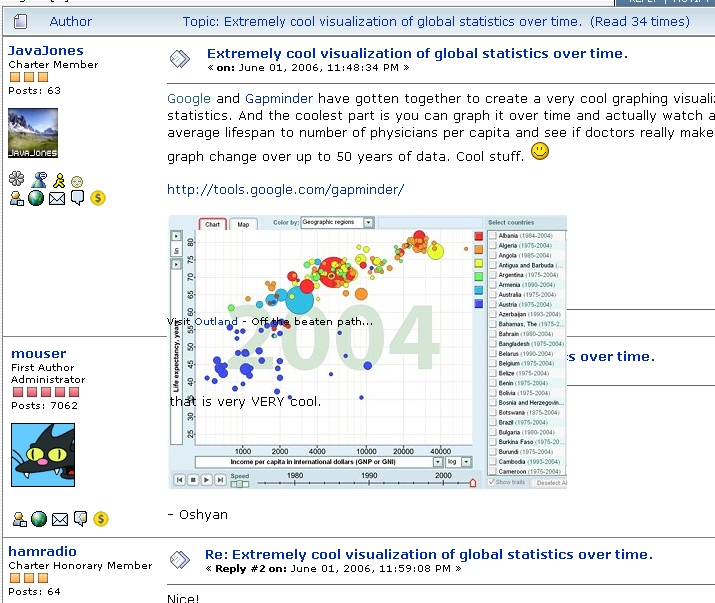
Weird... this is the 2nd time I've had rendering issues with Firefox....  Attached is what I see in the top of this thread.
Insert Brilliant Sig line here

jgpaiva

  • Artificial Idiocy
  • Global Moderator
  • Joined in 2006
  • *****
  • Posts: 4,727
    • Cody Award
    • Participated in NANY Challenge Once
    • Coding Snacks
    • Portugal Inhabitant
    • Linux User
Re: Extremely cool visualization of global statistics over time.
« Reply #5 on: June 02, 2006, 01:57 PM »
Weird... this is the 2nd time I've had rendering issues with Firefox....  Attached is what I see in the top of this thread.
:huh: :huh:
solution :P

Carol Haynes

  • Waffles for England (patent pending)
  • Global Moderator
  • Joined in 2005
  • *****
  • Posts: 8,073
    • Cody Award
    • Furry Fandom Badge - Furry Fandom
Re: Extremely cool visualization of global statistics over time.
« Reply #6 on: June 02, 2006, 02:45 PM »
Only if you like Opera - maybe I haven't given it enough of a chance but it doesn't feel at all intuitive to me - plus (big one) it doesn't support RoboForm.

urlwolf

  • Charter Member
  • Joined in 2006
  • ***
  • Posts: 1,837
    • Gathering Badge
    • Linux User
Re: Extremely cool visualization of global statistics over time.
« Reply #7 on: June 02, 2006, 04:27 PM »
Carol,
I think all that roboForm does, opera does by default (at least opera 9 beta)

Carol Haynes

  • Waffles for England (patent pending)
  • Global Moderator
  • Joined in 2005
  • *****
  • Posts: 8,073
    • Cody Award
    • Furry Fandom Badge - Furry Fandom
Re: Extremely cool visualization of global statistics over time.
« Reply #8 on: June 02, 2006, 05:31 PM »
Yes it may but I don't want to have to copy all my roboform data to Opera and then be stuck using only opera ...

Rover

  • Master of Smilies
  • Charter Member
  • Joined in 2005
  • ***
  • Posts: 633
    • Linux User
Re: Extremely cool visualization of global statistics over time.
« Reply #9 on: June 03, 2006, 05:06 AM »
Now things look totally normal.... weird.  :huh:
Insert Brilliant Sig line here

Gothi[c]

  • DC Server Admin
  • Charter Honorary Member
  • Joined in 2006
  • ***
  • Posts: 873
    • Gathering Badge
    • Coding Snacks
Re: Extremely cool visualization of global statistics over time.
« Reply #10 on: June 03, 2006, 06:23 AM »
Yeah, I had the same,... looked funky before, looks ok now.
That's a very interesting graph thingie. I passed the url to a friend of mine that studies geographics and demographics. Some interesting results.
I moved from Belgium to the US last year and there's some results there that I always suspected.
There's lots of industry in belgium and lots of city, not much nature around.
Mind you that belgium is a very tiny country, and yet, when you look at the CO2 emission graph(in tons per capita), it is way up there, very close to Japan. Then if you look at
the urban population percentage, it is the 4th in the world, scoring close to hong kong and Macao, in China.
Also interesting is when you look at the military budgets, the US scores very high, along with China.
Hehe, that last one kinda shows the urge to take over the world. Singapore is way up there, along with Jordan and Pakistan.

Then also interesting how Luxembourg is RICH!! if you look at income per capita.

Strange result: Why does Cuba have so many physicians?


db90h

  • Coding Snacks Author
  • Charter Member
  • Joined in 2005
  • ***
  • Posts: 481
    • Coding Snacks
    • Military Service Badge - US Army
    • Linux User
Re: Extremely cool visualization of global statistics over time.
« Reply #11 on: June 05, 2006, 04:27 PM »
Nice tool, but please remember that correlation does not equal causation. Like the example the first poster gave, (paraphrasing) "do more doctors per capita increase the average lifespan"? Even if the two are found to be in correlation, that's far from proving causation.

Statistics are evil, evil things designed to kill us all. Oh, wait, I didn't mean to type that.

JavaJones

  • Review 2.0 Designer
  • Charter Member
  • Joined in 2005
  • ***
  • Posts: 2,739
    • Participated in NANY Challenge Once
Re: Extremely cool visualization of global statistics over time.
« Reply #12 on: June 06, 2006, 01:31 AM »
Hehe, yes this is very true. My example was not intended to be particularly serious. Nonetheless it's fun to look at. :D

- Oshyan

Deozaan

  • Charter Member
  • Joined in 2006
  • ***
  • Posts: 9,827
    • Participated in NANY Challenge Eight Times
    • Cody Award
Re: Extremely cool visualization of global statistics over time.
« Reply #13 on: June 08, 2006, 06:36 AM »
Weird... this is the 2nd time I've had rendering issues with Firefox

That happens to me rarely, but when it does I just refresh the page and it's better. It's as if the CSS doesn't load properly or something.

Original address: https://www.donationcoder.com/forum/index.php?topic=3871.0