DonationCoder.com forum
 
Read-only archive. This is a static copy of the DonationCoder.com forum. Reading and searching work as before; logging in, posting and private messages do not.
Archive of 2026-10-21 · About this archive · Main site

Author Topic: cool interactive visualization of music relationships and social networks  (Read 11,058 times)

mouser

  • First Author
  • Administrator
  • Joined in 2005
  • *****
  • Posts: 40,931
    • Gathering Badge
    • Plugin Coding Medal
    • Participated in NANY Challenge Seventeen Times
    • Cody Award
    • Coding Snacks
    • Volunteers/Staff
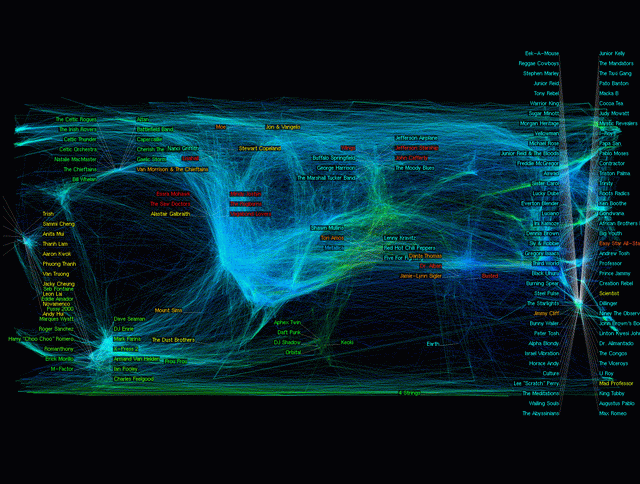
http://www.stanford.edu/~dgleich/demos/worldofmusic/interact.html
world_of_music3-R.gif

Quote
Afterwards, we used the user ratings to compute the similarity between the artists. Essentially, for each pair of artists, we counted the number of users that rated both artists highly to determine the similarity. This operation gave us the artist-artist similarity graph. In the image below, we show the clustered adjacency matrix of the graph. The blocks you see in the middle of the picture are similar groups of artists. (In fact, this is how we got the color for each artist in the final picture.)

Original address: https://www.donationcoder.com/forum/index.php?topic=2746.0