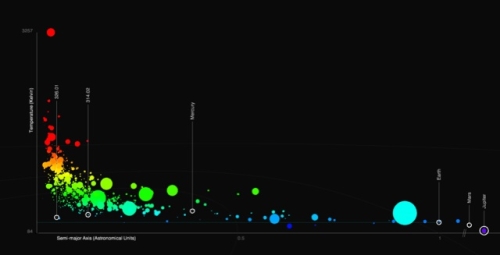
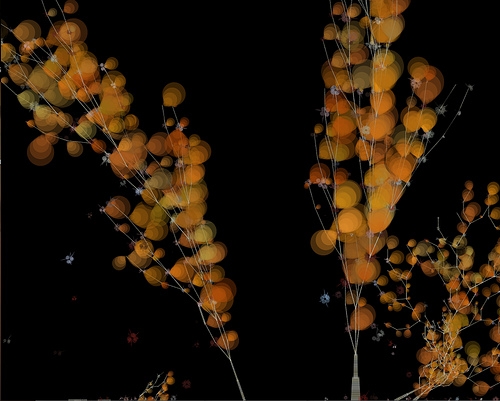
With last week's public release of data from NASA's Kepler Mission some very interesting and potentially insightful ways of examining the data sets are beginning to appear. Which points to the value of involving the public in some of the "Big Science" being done our researchers.
For those who don't know about the Kepler Mission:
An unusually interesting article on independent data visualization can be found over at BoingBoing. It discusses some of the work being done by Jer Thorp.
[attach]
For those who don't know about the Kepler Mission:
Quote
Importance of Planet Detection
The centuries-old quest for other worlds like our Earth has been rejuvenated by the intense excitement and popular interest surrounding the discovery of hundreds of planets orbiting other stars.
There is now clear evidence for substantial numbers of three types of exoplanets; gas giants, hot-super-Earths in short period orbits, and ice giants. The following websites are tracking the day-by-day increase in new discoveries and are providing information on the characteristics of the planets as well as those of the stars they orbit: The Extrasolar Planets Encyclopedia, NASA/IPAC/NExScI Star and Exoplanet Database, New Worlds Atlas, and Current Planet Count Widget.
The challenge now is to find terrestrial planets (i.e., those one half to twice the size of the Earth), especially those in the habitable zone of their stars where liquid water and possibly life might exist.
The Kepler Mission, NASA Discovery mission #10, is specifically designed to survey a portion of our region of the Milky Way galaxy to discover dozens of Earth-size planets in or near the habitable zone and determine how many of the billions of stars in our galaxy have such planets.
Results from this mission will allow us to place our solar system within the continuum of planetary systems in the Galaxy.
An unusually interesting article on independent data visualization can be found over at BoingBoing. It discusses some of the work being done by Jer Thorp.
Quote
Jer is a native of Vancouver, Canada, but he currently makes his home in New York City, where he is the New York Times' Data Artist in Residence and a visiting professor at New York University. He's also a contributing editor at Wired UK. Shortly after the Kepler data release, Jer and I started talking about how he could dynamically visualize both the magnitude and the nuance of the discoveries. This is what we came up with.
[attach]