| Application Name | Filtration: A Task Manager |
| Version | 0.90 |
| Short Description | Yet another program for watching processes and their resource usage |
| Supported OSes | Windows Only |
| Web Page | This One |
| Download | Attached to this post |
| System Requirements | 64-bit currently |
| Version History | v0.90 -- initial public release |
DescriptionA task manager / process watcher to view resource utilization of individual processes.
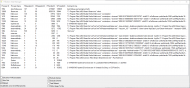
ScreenshotResource Utilization View:
 NANY 2020 - Filtration: A Task ManagerBackground
So, I know that this has been done over and over again, but I wanted to offer my process monitor in my day-to-day life. I tend to use this program whenever I notice my PC is bogged down and I need to figure out which pesky process is the one that is using up all my HDD/SSD resources. It has also helped me refine resource utilization in my own scripts/applications, so that they don't hit the hard drive in cases where it isn't necessary.
In particular, what I find useful about this app is that it breaks down the HDD/SSD utilization into four categories: Read/Write, and Operation Count as well as an amount of data Tranferred (Transfer Count). This can help you get a quick understanding of whether or not the pesky culprit process is making lots of little read/write operations, or if the culprit is making one or two large transfers that involve large files.
Some of the existing programs out there use a percentage for displaying HDD/SSD utilization, which might be a useful way to simplify things some of the time, but in cases where you're debugging your own scripts that you've written (or have some sort of a 'clear box' understanding of what the software might be doing), you can get a better understanding by looking at data that is broken down into reads vs writes, and operation count vs bytes transferred. If you are specifically looking at the usage of HDDs makes this breakdown especially useful, since the physical movement of the disks to a different location causes significant interruptions in data transfer and can cause more slowdowns than just looking at a percentage rate of transfer would suggest.
In addition, as this tool evolved, I added in some other features to filter out applications/processes that I wasn't interested in. For instance, Google Chrome tends to show a lot of processes that I'm not worried about, especially if multiple tabs are open.
Features- Process Name and view of command line arguments that were used in launching that process
- Ability to filter out programs that have 0% HDD/SSD utilization
- Slow or Fast Refresh
- Write data to a file (but realize, this is kinda a weird concept, because you're creating more utilization this way, but may be helpful for overnight monitoring)
- Exclude Google Chrome from the list
- Show only AutoHotkey scripts
UsageInstallationUnzip the zip file to your preferred location.
Using the ApplicationOpen the exe file to launch the application. When you launch the application, a large grid will be displayed, showing a list of processes, with information about their HDD/SSD usage. You can double-click on a listed process to terminate that process (this kills the application in an ungraceful manner, so the process is not given any time to wrap up the work that it was in the middle of).
Checkboxes displayed along the bottom of the window show options for disabling refresh of the listview (so that you can take your time and look through a snapshot of the entire list of processes, if needed). Refresh speed can also be increased with the 'fast refresh' option. Resource usage statistics can also be written out to a file on disk, which can be useful for overnight monitoring of specific applications. Automatically refreshing sort of the highest usage data can be enabled/disabled. Additional checkboxes are available to reduce the number of processes shown in the listview to only those that are of interest.
UninstallationDelete the unzipped folder.
Known Issues- Refresh is sometimes a bit weird if you are switching from a slow refresh to a fast refresh
- If you're showing all processes, refreshing the listview in the GUI can take a while
Future Improvements- Include RegEx
- Exclude RegEx
- Custom File Output Path
- CPU Utilization (but honestly that's not high on my list since Windows Task Manager already does that)

